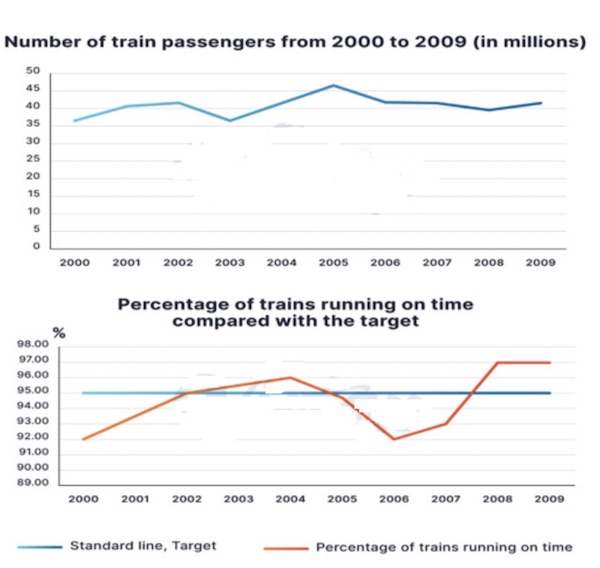
The first graph shows the number of train passengers from 2000 to 2009; the second shows the percentage of trains running on time during the period. Write a report by selecting key features and make comparisons when relevant.

Sample Band 8:
The line graphs present the quantity of train users and the proportion of punctual trains in a city between 2000 and 2009.
It is clear that there was an upward trend in both the number of train commuters and the proportion of trains running on time over the period shown. In addition, the percentage of punctual trains was above the target from 2002 to 2005 and from 2008 to 2009.
The number of train users started at over 35 million in 2000 and then gradually increased to around 41 million 2 years later. It dropped significantly in 2003 before reaching a peak of roughly 46 million in 2005. During the following 3 years, it experienced a slight but steady drop and then rose back to 41 million in the final year.
The proportion of trains running on time started at 92% in 2000, which was significantly below the target of 95%. It then steadily rose to 96% in 2004 before falling back to 92% in 2006. It however rose steadily again during the next two years, peaked at 97% in 2008 and remained unchanged in the final year.
(188 words)

Bộ Sách Ielts Writing 8.0 Task 1 + 2 by Dương Vũ 8.0 WRITING bao gồm SÁCH HƯỚNG DẪN CHI TIẾT CÁCH LÀM + 200 SAMPLES + VIDEO BÀI GIẢNG + LỘ TRÌNH HỌC gồm tất cả những gì bạn cần để học tốt writing nên tương đương với 1 khóa học Ielts Writing 15 tuần mà chi phí rât khiêm tốn. Rất nhiều bạn tốn cả chục triệu đồng thi lại Ielts vì không học đúng tài liệu chuẩn, thực sự lãng phí cả tiền bạc, thời gian và cơ hội: https://idvielts.com/sach-ielts-writing-by-duong-vu/
https://idvielts.com/sach-ielts-speaking-duong-vu/


