Bài giảng dưới đây là một phần trong sách Ielts Writing Task 8.0 by Dương Vũ, combo sách tự học Ielts 7.0 – 8.0 siêu tiết kiệm, hiệu quả đã giúp nhiều bạn tự học Ielts 7.0, 7.5 , 8.0:


Kinh nghiệm viết luân Ielts WRITING 8.0: https://idvielts.com/kinh-nghiem-viet-luan-ielts-band-8/
Hướng dẫn chung:
- Đọc kĩ hướng dẫn về cách viết PERCENTAGE Language trong SLIDE BÀI GIẢNG kèm sách
- Dạng pie chart chỉ cần so sánh kích cỡ các pie là ra trend (xu hướng- dạng động) hoặc thứ hạng (dạng tĩnh)
- Đề có nhiều biểu đồ tròn thường có thể so sánh với nhau (trừ đề dưới đây nên phân tích rời vì chúng không liên quan gì đến nhau).
- Luôn gộp các pie bằng hoặc gần bằng nhau để đỡ lặp cấu trúc
- Xếp hạng các pie để viết dài hơn trong trường hợp bài ít dữ liệu
- Quy từ % sang phân số (a quarter, one fifth, one third …) cho đỡ lặp từ
Bài mẫu band 8 – 9 dạng Pie Chart các bạn tham khảo cấu trúc hay in đậm:
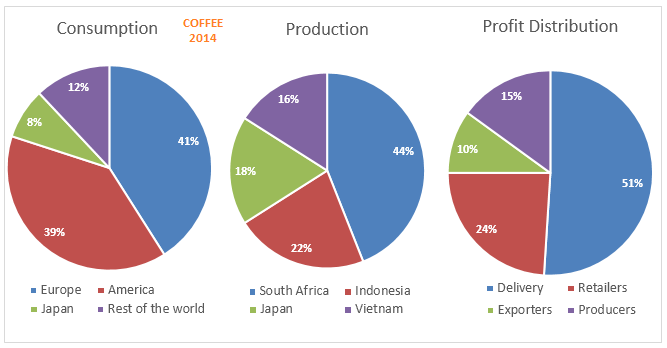
Đề Pie Chart: Consumption, production and profit distribution of coffee in 2014
The charts show data about the proportion of coffee consumed and produced by different countries and areas across the globe and how profit from it was distributed in 2014.
Overall, Europe was by far the largest coffee consumer while South Africa was the biggest coffee producer. In terms of profit distribution, logistics earned the most significant share.
In 2014, Europe accounted for 41% of the global coffee consumption, followed by America at 39%. Japan represented over a tenth while the remaining parts of the world made up less than 10%. Of the four major producers, South America constituted the largest percentage (44%), and this was twice as much as that of Indonesia. Vietnam occupied the third position whereas Japan represented the lowest proportion, at 16%.
With regard to coffee profit, over a half went to transportation companies compared to roughly a quarter for retailers. Producers, by contrast, secured a far lower share (15%), which was merely 5 percentage points larger than the figure for exporters.
* Lưu ý: tăng từ 10 lên 15 thì là increase by 50% (fifty percent) nhưng tăng từ 10% lên 15% thì là increase by 5 percentage points
PIE CHART LEARNING ENGLISH 3 COUNTRIES (6 biểu đồ tròn: Có 2 năm nhưng 3 nước => thân bài 2 đoạn phân tích theo 2 năm logic hơn)
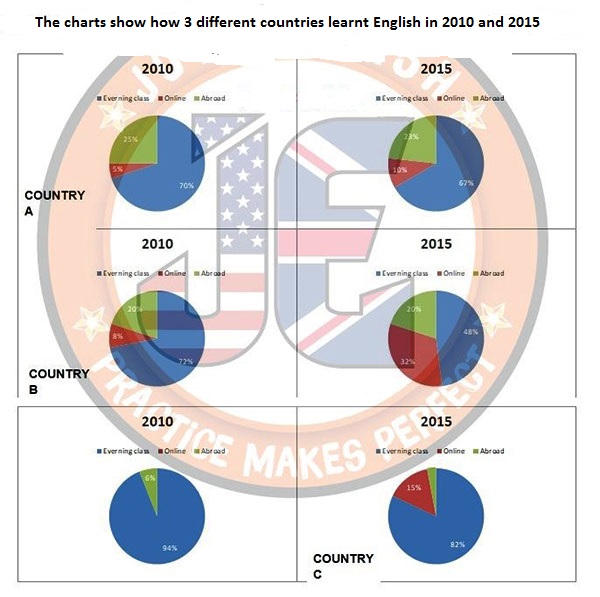
The pie charts show data about different English learning *methods used in three countries in 2010 and 2015. (*cấu trúc rút gọn V-ed hay V-ing dùng nhiều trong mở bài)
It is clear that all these countries saw a decline in preference for physical English classes and going abroad during the period shown. By contrast, learning English online was increasingly preferred in three nations.
In 2010, up to 94% of English learners in country C went to an evening class compared to around 70% in the other two countries. The second most popular method was moving to an English speaking country, which was adopted by one quarter and one fifth of leaners in country A and country B respectively. Learning English online was most favoured in country B (8%) while country C did not deploy this solution.
By 2015, the proportion of English students enrolled in traditional evening classes in countries A and C dropped slightly whereas that of country B fell by 24 percentage points. This country continued to have the largest share of online learning that year (32%), followed by country C (15%). With regard to going abroad, the figures for countries A and B did not vary greatly but the other country experienced a twofold decrease. (* Các cụm từ highlight thể hiện cách referencing liên kết câu linh hoạt, trôi chảy, tránh lặp từ)
PIE CHART SURVEY OF BOWEN ISLAND (lưu ý các thuật ngữ riêng cho dạng có survey)
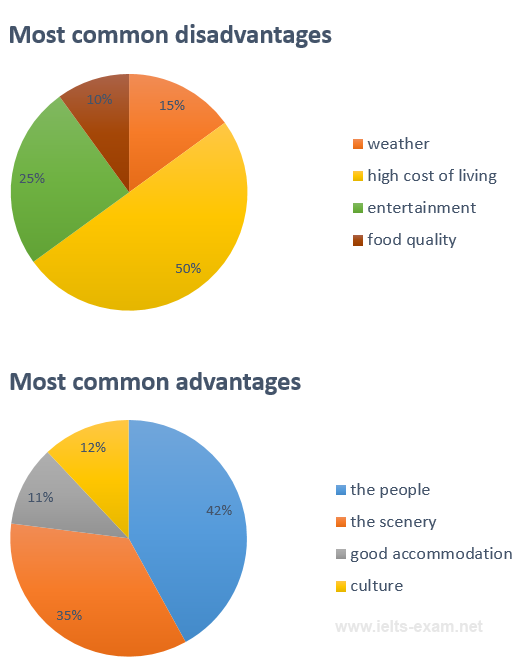
The pie charts show the results of a visitor survey on the merits and demerits of an island called Bowen.
It is clear that the major reason why the respondents were unhappy with the destination is its expensive cost of living. By contrast, what most of them were fascinated with are local people.
As can be seen in the advantages chart, one in two people surveyed agreed that living expenses on the island are too high while a quarter of them were dissatisfied with its entertainment facilities. Those expressed their dissatisfaction about food quality and the weather accounted for 10 percent and 15 percent respectively.
With regard to the merits, 42 percent stated that the people are the island’s greatest appeal. Its second most significant advantage is spectacular scenery which was favoured by more than one third of the respondents. Finally, similar proportions of the visitors expressed their approval of the island’s decent accommodation and fascinating culture, at just slightly over ten percent each.
(Tip: nếu ít từ viết percent thay vì %, và dùng cụm nối dài như: As can be seen in the …)
PIE CHART WATER USE BY AREA (đề nhiều đối tượng, nhớ tìm ra quy luật/ pattern để gộp)
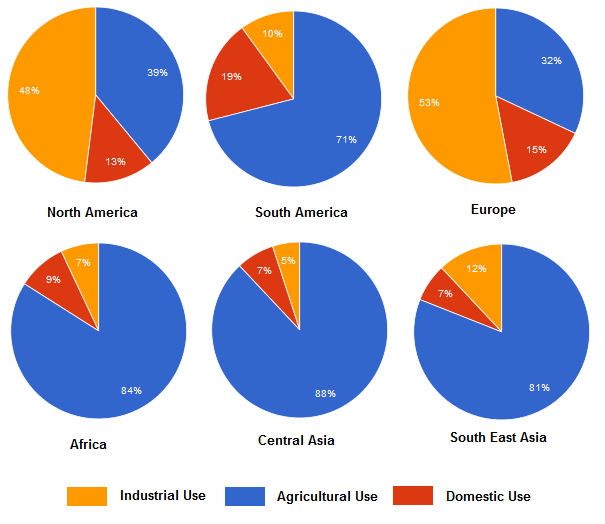
The pie charts compare the percentages of water used for three different purposes in six regions across the world.
It is clear that industrial sector accounts for the largest shares of water consumption in North America and Europe. In contrast, agriculture is responsible for most of the water used in four other areas.
More specifically, North America and Europe have similar patterns of water consumption, with around 50% being used for industrial activities, over 30% going to agricultural production and the rest being consumed by households. By contrast, the largest percentage of water consumption in South America goes to agriculture (71%) while industries uses only one tenth. This region also has the highest share of domestic water use, at 19%.
With regard to the remaining regions, agriculture represents the overwhelming majority of water consumption in Africa, Central Asia and Southeast Asia (over 80%). Conversely, less than 10% is used by industries or households in all these regions, with the exception of South East Asia where industrial production consumes up to 12%.
PIE CHART ENERGY SOURCE AUSTRALIA – FRANCE (đề này không phải là %, nhưng vẫn có pie)
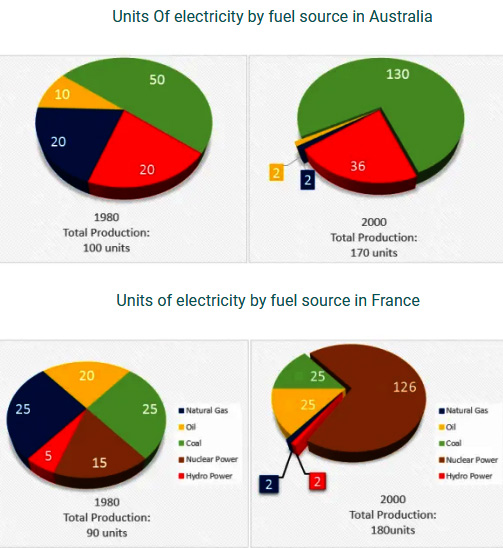
The pie charts compare the amount of electricity generated by different sources in Australia and France between 1980 and 2000. (pie đầu tổng 100 units, có thể quy số lượng thành %)
It is clear that in 1980, the majority of electricity in both countries were produced from coal and natural gas. By 2000, coal remained the most significant energy source of Australia while nuclear power became the dominant source in France.
In 1980, coal accounted for half of electricity output in Australia, at 50 units while natural gas and hydro power represented 20% each, and the rest came from oil. By 2000, Australia’s total electricity production had increased to 170 units. Coal remained the largest source (130 units), followed by hydro power. The amounts generated from natural gas and oil, however, decreased tenfold and fivefold respectively.
In France, coal and natural gas were the two largest sources of energy in 1980 (25 units each). By 2000, the country’s total output had doubled, reaching 180 units. Nuclear power saw the most dramatic increase from 15 units to 126 units whereas natural gas and hydro power experienced the most remarkable declines, generating only 2 units each. The shares of other fuel sources also reduced considerably though electricity production from coal stayed at the same level and that of oil rose by 5 units.
(Lưu ý: the output/ amount of electricity generated from coal chứ không viết the output of coal – sản lượng than)
(Bạn có thể đặt mua sách Ielts Writing 8.0 + Video Bài Giảng chi tiết để học viết thành thạo Ielts writing task 1 từ giáo viên Ielts 8.0 Writing )
Kinh nghiệm viết luân Ielts WRITING 8.0: https://idvielts.com/kinh-nghiem-viet-luan-ielts-band-8/
Khóa học Ielts Chuyên Sâu 6.5 – 8.0: https://idvielts.com/category/khaigiang/
Follow Dương trên các Facebook sau để học các bài học Ielts 8.0+ hoàn toàn miễn phí và cập nhật nhất các bạn nhé: